Reponse Volatility in Large Language Models
Christian Bias Benchmarks
Measuring how much LLMs change their answers is important because we want them to give consistent responses.
This is especially true in a Christian context where some facts—like names of people or events that took place—are seen as fixed and not open to interpretation.
When LLMs provide different answers to the same questions, it can create confusion or misunderstandings about important beliefs.
By keeping their answers stable, we can make sure they offer reliable information that aligns with what is accepted as true in the Christian faith.
…so we ran a test.
We wanted to explore whether the responses to identical questions changed and, if so, by how much. To do this, we asked 5 different LLMs 25 questions, 10 times each, and measured how much their responses varied.
To understand the degree of change, we calculated how different two text responses are from each other.
Enter Levenshtein Distance
Levenshtein distance may sound technical, but it’s quite straightforward. It counts how many small changes (like adding, removing, or swapping characters) are needed to turn one piece of text into another.
For example, changing “cat” to “bat” would require just one change (swapping “c” for “b”).
In this experiment, we used Levenshtein distance to see how much each answer changed from the previous one.
The smaller the distance, the more consistent the answer was over time. Larger distances suggest the LLM’s answers changed more significantly between attempts.
Results: How Much Did the Answers Vary?
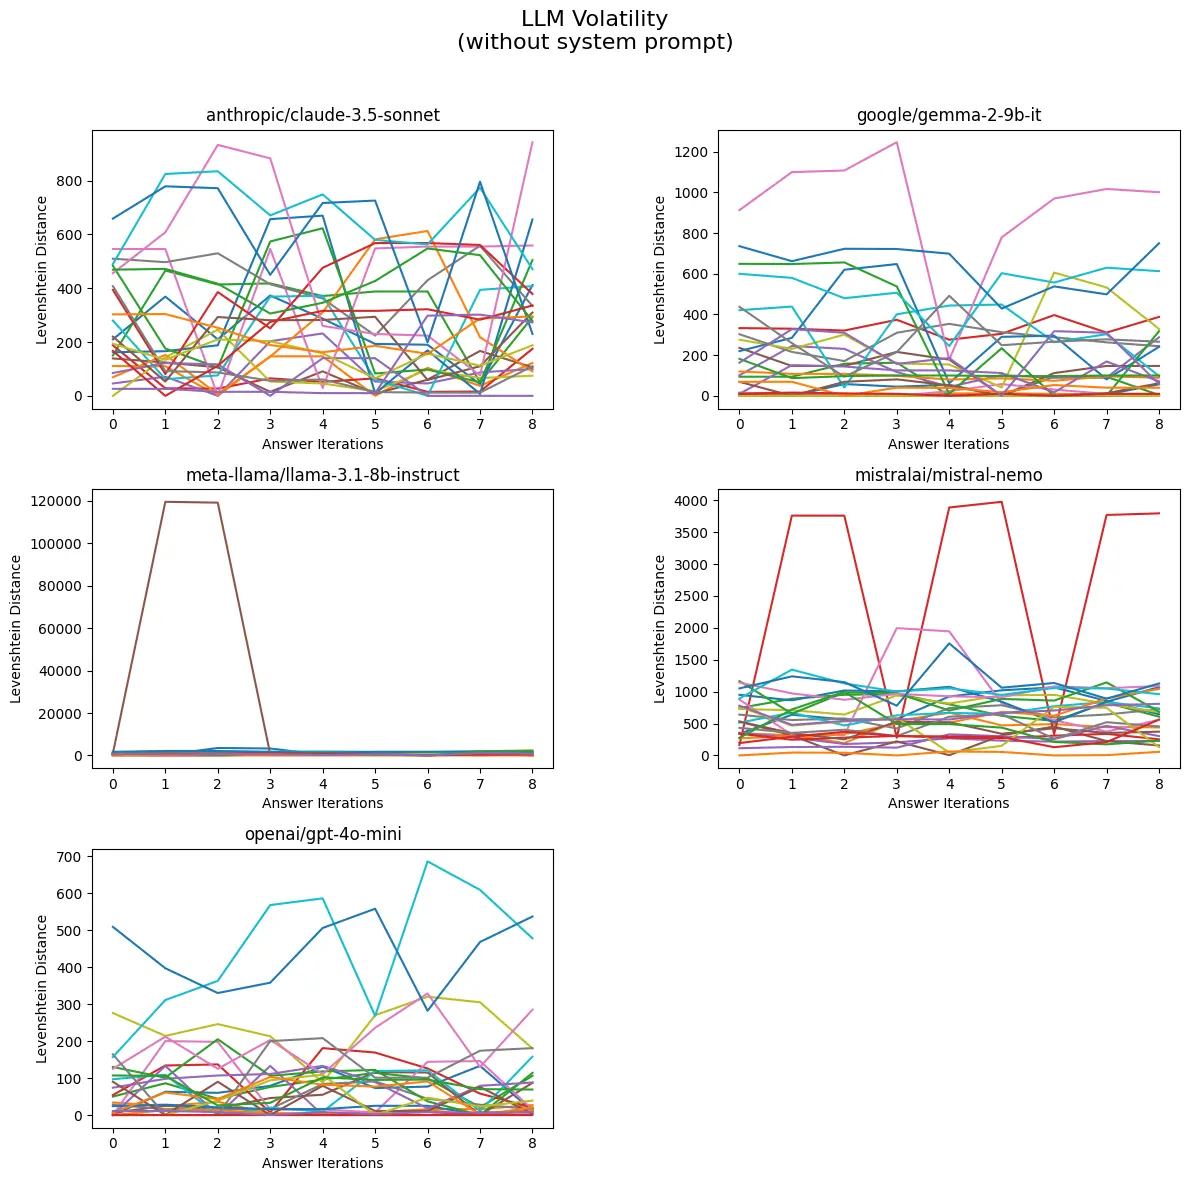
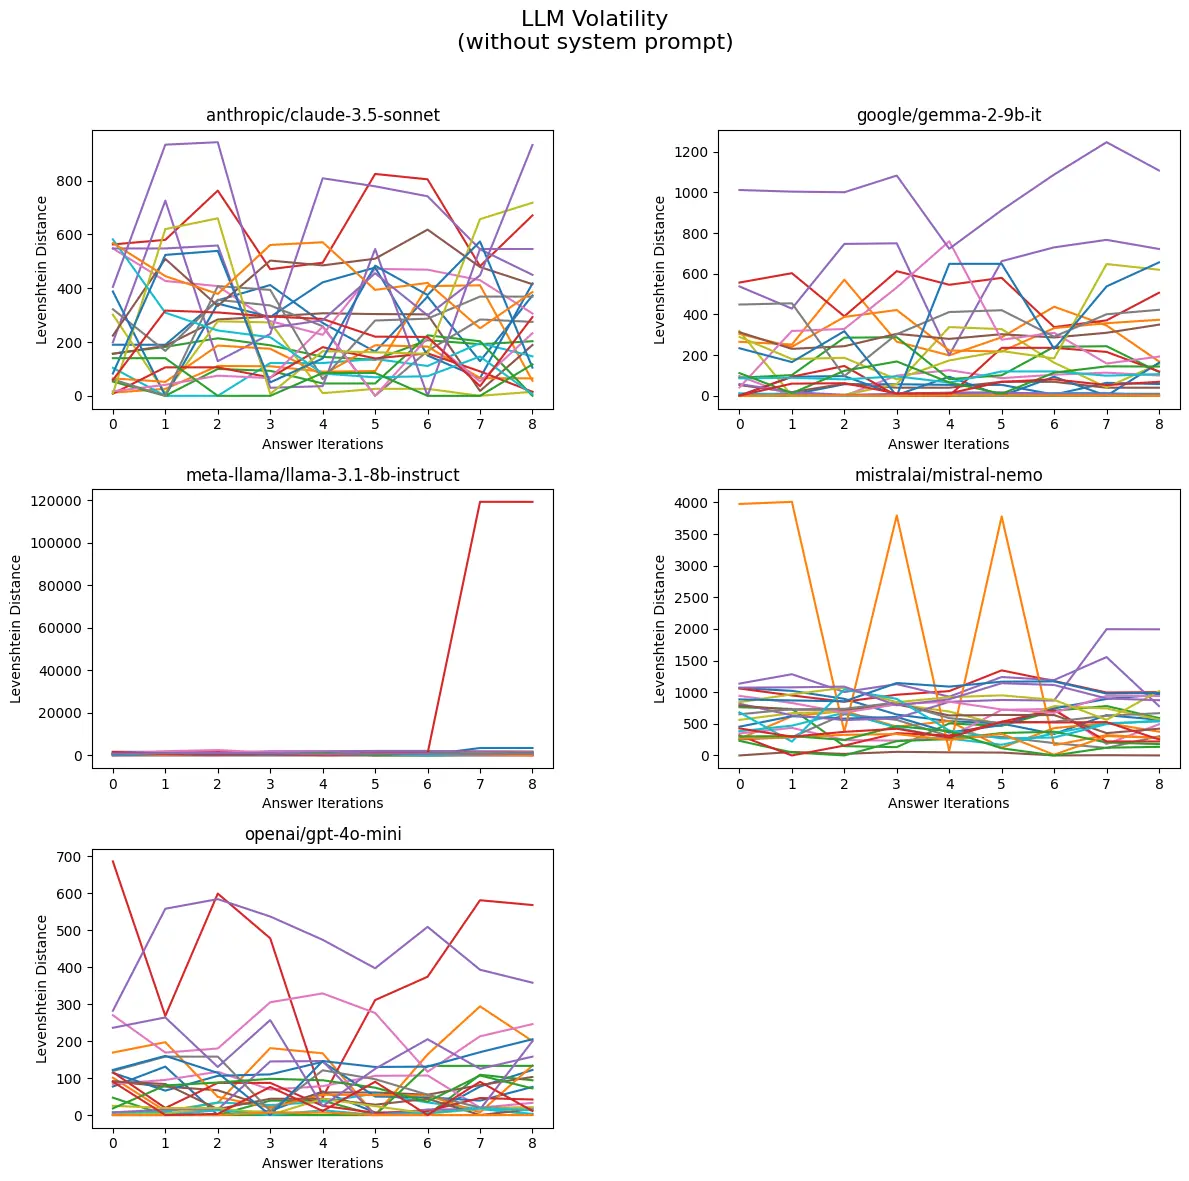
Each line in the graph below represents a specific question and shows how much the LLM’s answers changed over 10 responses.
Some answers stayed fairly consistent (with small changes), while others fluctuated quite a bit (larger differences).
Without System Prompt
Here we show the mean volatility for each large language model without using a system prompt. This means that the answer is written as the LLM sees fit.

Mean Volatility of LLMs Without System Prompt
The following table presents the volatility values for various models without using a system prompt.
| Model | Volatility |
|---|---|
| meta-llama/llama-3.1-8b-instruct | 8.64 |
| mistralai/mistral-nemo | 8.63 |
| anthropic/claude-3.5-sonnet | 8.59 |
| google/gemma-2-9b-it | 8.51 |
| openai/gpt-4o-mini | 8.32 |
Key Observations
Highest Volatility: The meta-llama/llama-3.1-8b-instruct model has the highest volatility at 8.64, indicating it may exhibit the most variability in performance among the listed models.
Close Volatility Values: The models mistralai/mistral-nemo (8.63) and anthropic/claude-3.5-sonnet (8.59) have very similar volatility values, suggesting they perform comparably under similar conditions.
Lowest Volatility: The openai/gpt-4o-mini model has the lowest volatility at 8.32, indicating it may provide more stable and consistent outputs compared to the other models in this set.
With System Prompt
Here we show the mean volatility for each large language model but using a system prompt. To our surprise, responses more volatile when given clear instructions on how to answer.
The system prompt was:
You are a helpful assistant that responds in a clear and simple manner.

Mean Volatility of LLMs With System Prompt
The following table presents the volatility values for various models but this time using a system prompt.
| Model | Volatility |
|---|---|
| anthropic/claude-3.5-sonnet | 14.60 |
| openai/gpt-4o-mini | 13.78 |
| google/gemma-2-9b-it | 5.46 |
| meta-llama/llama-3.1-8b-instruct | 8.26 |
| mistralai/mistral-nemo | 7.89 |
Key Observations
Highest Volatility: The anthropic/claude-3.5-sonnet model has the highest volatility at 14.60, indicating significant variability in its performance.
Second Highest Volatility: The openai/gpt-4o-mini model follows closely with a volatility of 13.78, suggesting it also experiences considerable fluctuations.
Lowest Volatility: The google/gemma-2-9b-it model exhibits the lowest volatility at 5.46, indicating it provides more stable and consistent outputs compared to the other models.
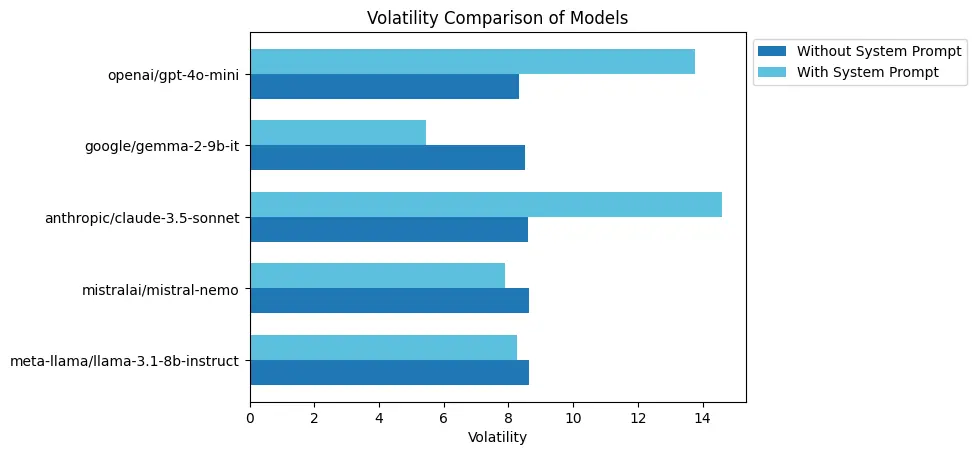
Volatility Comparison

Key Observations
Highest Volatility with System Prompt: Anthropic/claude-3.5-sonnet shows peak volatility (14.60).
Lowest Volatility with System Prompt: Google/gemma-2-9b-it exhibits the least volatility (5.46).
Comparison of Models Without System Prompt: Meta-llama has the highest volatility (8.64), while OpenAI’s model has the lowest (8.32).
Impact of System Prompt on Volatility: System prompts generally increase volatility, especially in specific models.
Overall Volatility Range: Wider volatility range observed with system prompts compared to without.
This analysis offers a glimpse into how LLMs handle repeated questions and how much their responses can vary over time. The Levenshtein distance metric gives us a way to quantify those changes, revealing which questions and LLMs are more consistent. As LLMs continue to evolve, these insights will play a key role in improving their reliability and usefulness in real-world applications.
We’ll continue to refine our approach and share updates as we dig deeper into LLM behavior.
Do you have thoughts on this study or suggestions for further research? Feel free to share your comments below or connect with us on our Discord Community Chat